Token Burn
Claude Code로 하루를 보내면 대략 5만에서 20만 토큰이 사라진다. Codex를 병행하면 그 이상이다. 대부분은 이 숫자를 모른다. 알게 되는 순간은 한도에 걸렸을 때뿐이다.
"5시간 한도에 도달했습니다."
그때는 이미 늦었다. 작업 흐름이 끊기고, 리셋까지 기다려야 한다. CLI에서 /cost를 치면 현재 세션은 나오지만 오늘 전체를 볼 수 없다. 여러 터미널, 여러 프로젝트, 여러 에이전트가 동시에 토큰을 태우고 있는데 총합을 볼 방법이 없다.
그래서 Token Burn을 만들었다. macOS 메뉴바에 상주하는 작은 앱이다.

셀 하나에 두 값이 들어 있다. 가로 채움은 5시간 한도의 잔여량, 세로 높이는 7일 한도의 잔여량. 여유가 있으면 바가 가득 차 있고, 소진되면 줄어든다. 확인하는 데 0.5초면 된다. 에이전트가 실제로 API를 호출하는 동안에는 바가 미세하게 뛴다. heartbeat.
같은 문법을 시스템 부하에도 그대로 얹었다. 서비스 셀 옆에 로드 셀이 하나 더 있고, 여기서는 가로가 CPU, 세로가 GPU, 색이 메모리 압력이다. 에이전트를 오래 돌리면 토큰만 타는 게 아니라 맥도 달아오른다. 얼마나 남았는지와 지금 얼마나 태우고 있는지를, 하나의 시각 언어로 나란히 보게 하고 싶었다.
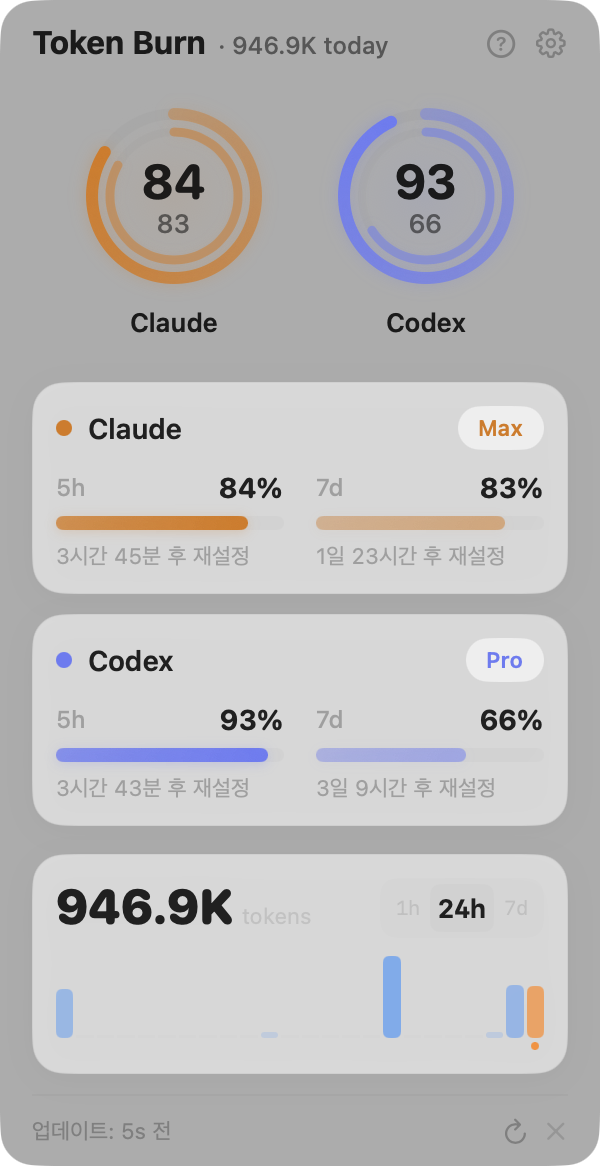
아이콘을 누르면 패널이 열린다. 서비스별 원형 게이지가 5시간·7일 잔여량과 리셋까지 남은 시간을 보여주고("3시간 38분 후 초기화"), 그 아래 토큰 번 차트가 1시간·24시간·7일 구간을 트랙패드 스크롤로 넘긴다. 차트의 숫자는 캐시 읽기·쓰기 단가까지 반영한 API 환산 비용이다. 기존 도구는 대부분 얼마나 썼나를 보여주는데, Token Burn은 얼마나 남았나를 먼저 보여준다. "53% 사용"보다 "47% 남음"이 행동을 바꾼다.
만들면서 가장 애먹은 건 화면이 아니라 숫자의 정확성이었다. 처음에 Codex 토큰 집계가 실측보다 열아홉 배 부풀어 있었다. 세션마다 누적치가 적히는데 그걸 매 턴 합산해 버린 탓이었다. 집계를 턴별 델타 방식으로 다시 짜고, 재개하거나 컴팩션된 세션에 복사되어 들어온 히스토리를 중복 제거하고 나서야 Claude의 /stats와 맞아떨어졌다. 데이터는 Claude Code의 세션 로그(~/.claude/projects/**/*.jsonl)와 Codex의 세션 로그(~/.codex/sessions/**/*.jsonl)를 직접 파싱한다. 수백 MB짜리 세션 파일을 통째로 메모리에 올리던 초기 버전이 CPU를 붙들고 놓지 않아서, 지금은 파일을 스트리밍으로 훑고 바뀐 파일만 다시 읽는다. 서버로 나가는 건 없다.
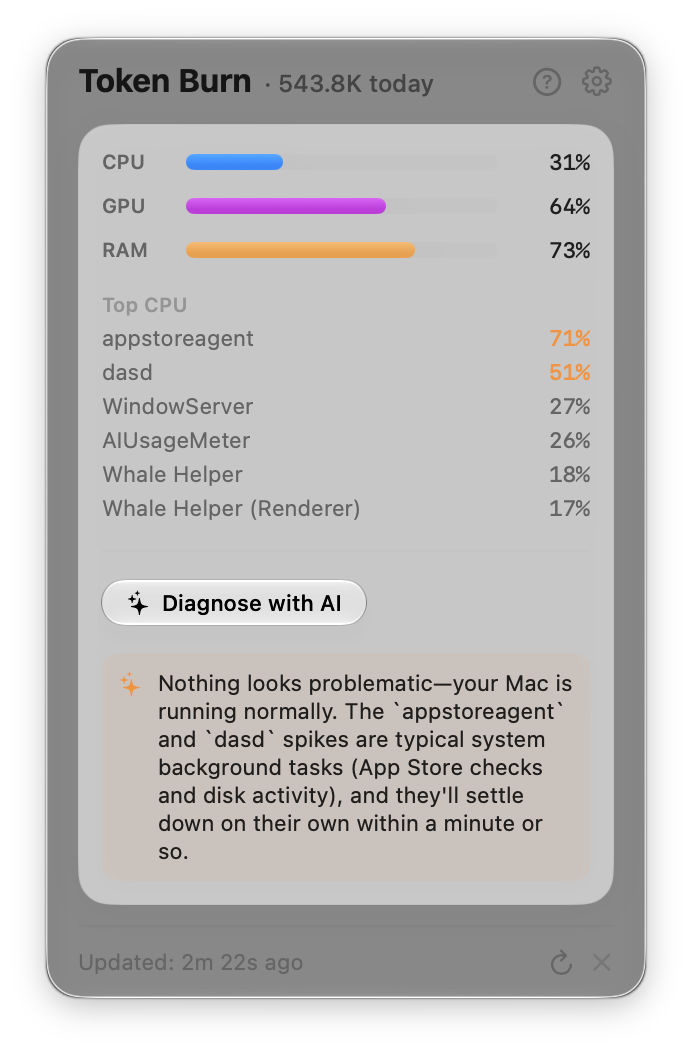
부하 이야기가 나온 김에 하나 더. 맥이 실제로 뜨거워지는 순간, 원한다면 Token Burn이 CPU를 가장 많이 먹는 프로세스 이름과 열 상태만 추려 당신의 Anthropic API 키로 Claude에 물어보고, 무엇이 원인이고 어떻게 식힐지를 한 줄로 알려준다. 옵트인이고, 키를 넣지 않으면 아예 돌지 않으며, 밖으로 나가는 것은 프로세스 이름과 열 단계뿐이다. 토큰도 파일 내용도 보내지 않는다.
이 앱은 처음부터 끝까지 읽기 전용 뷰어다. 토큰에 대해서는 편집증적으로 굴었다. 새 API 키나 비밀번호를 묻지 않고 CLI가 이미 가진 OAuth 자격을 재사용하며, 그 토큰은 각 제공자의 API 호스트로만 나간다(설정 파일이 조작돼도 다른 곳으로 새지 못하도록 하드 allowlist). 자격 파일은 0600 권한으로 쓰고, 자동 업데이트는 Ed25519 서명된 피드와 공증 검증, Developer ID 핀에 다운그레이드 방지까지 삼중으로 확인한다.
설치는 한 줄이다.
brew install --cask multi-turn-inc/tap/token-burnmacOS 26(Tahoe) 이상, Claude Code나 Codex CLI가 깔려 인증돼 있으면 된다. 오픈소스다. GitHub: multi-turn-inc/ai-usage-meter
A full day with Claude Code burns roughly 50,000 to 200,000 tokens. Run Codex alongside it and the number climbs higher. Most people never see it. The one moment they do is when they hit the limit.
"You have reached the 5-hour limit."
By then it is already too late. The workflow breaks, and you wait for the reset. Typing /cost in the CLI shows the current session, but never the whole day. Multiple terminals, multiple projects, multiple agents are all burning tokens at once, and there is no way to see the total.
So I built Token Burn. A small app that lives in the macOS menu bar.
One cell holds two readings. The horizontal fill is what remains of the 5-hour quota; the vertical height is what remains of the 7-day quota. When there is room to spare the bars are full, and as the quota drains they shrink. Half a second is enough to check. While an agent is actually calling APIs, the bars twitch. A heartbeat.
The same grammar carries over to system load. Next to the service cells sits one more cell, where the horizontal fill is CPU, the height is GPU, and the color is memory pressure. Run agents long enough and it is not only tokens that burn — the Mac heats up too. I wanted how much is left and how hard you are pushing right now to read in a single visual language, side by side.
Click the icon and a panel opens. A circular gauge per service shows the 5-hour and 7-day quota remaining with a reset countdown ("3h 38m until reset"), and below it a token-burn chart moves between 1-hour, 24-hour, and 7-day scopes with a trackpad scroll. The numbers on the chart are API-equivalent costs that account for cache read and write pricing. Most tools show how much you have used; Token Burn shows how much is left, first. "47% remaining" changes behavior in a way that "53% used" does not.
The hardest part was not the screen but the accuracy of the numbers. At first the Codex token count was inflated nineteen-fold. Each session records a running total, and I was summing that total on every turn. Only after rewriting the accounting as per-turn deltas — and deduplicating the history copied into resumed or compacted sessions — did it line up with Claude's /stats. The data is parsed directly from Claude Code's session logs (~/.claude/projects/**/*.jsonl) and Codex's session logs (~/.codex/sessions/**/*.jsonl). An early version loaded whole session files, hundreds of megabytes each, into memory and pinned the CPU; now it streams each file and re-reads only the ones that changed. Nothing is sent to a server.
Since we are on the subject of load: when the Mac actually runs hot, Token Burn can — if you let it — take just the names of the top CPU processes and the thermal state, ask Claude through your own Anthropic API key, and tell you in one line what is cooking and how to cool it. It is opt-in, it does not run at all without a key, and the only thing that leaves the machine is process names and a thermal level. No tokens, no file contents.
The app is a read-only viewer from end to end, and paranoid about your tokens. It never asks for a new API key or password; it reuses the OAuth credentials the CLI already holds, and those tokens only ever go to each provider's own API hosts (a hard allowlist, so a tampered config file can't redirect them). Credential files are written with 0600 permissions, and auto-update is triple-checked: an Ed25519-signed feed, a notarization assessment, and a Developer ID pin, with downgrade protection.
Installing is one line.
brew install --cask multi-turn-inc/tap/token-burnIt needs macOS 26 (Tahoe) or later, with Claude Code or Codex CLI installed and authenticated. It is open source. GitHub: multi-turn-inc/ai-usage-meter